A single high-fidelity FEA simulation of the macro-scale accelerometer takes ~45 minutes on a 32-core workstation. Design space exploration requires thousands of evaluations. Brute-force optimization is intractable.
1.35M×Speedup: ~2 ms inference vs 45 min simulation
6DParametric space mapped to 6 output objectives
02 — Parametric Space
Six Geometric Parameters
Six geometric parameters define the design space. Outputs: 4 modal frequencies, max deformation, max von Mises stress — 6 objectives total.
Parameter
Symbol
Range
Units
Beam Length
L
[8, 16]
mm
Beam Width
W
[2, 6]
mm
Beam Height
H
[0.5, 2.0]
mm
Fillet Radius
R
[0.2, 1.0]
mm
03 — Sensitivity
Jacobian Sensitivity Analysis
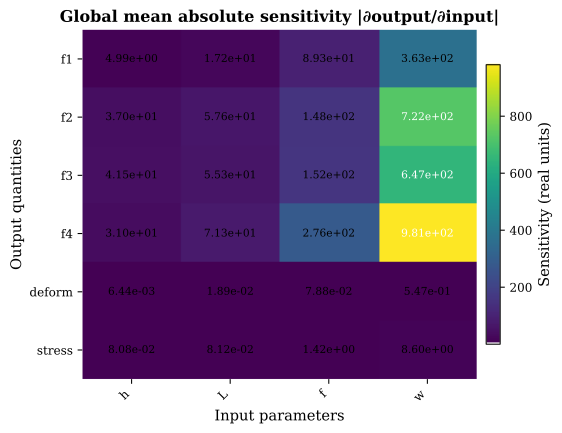
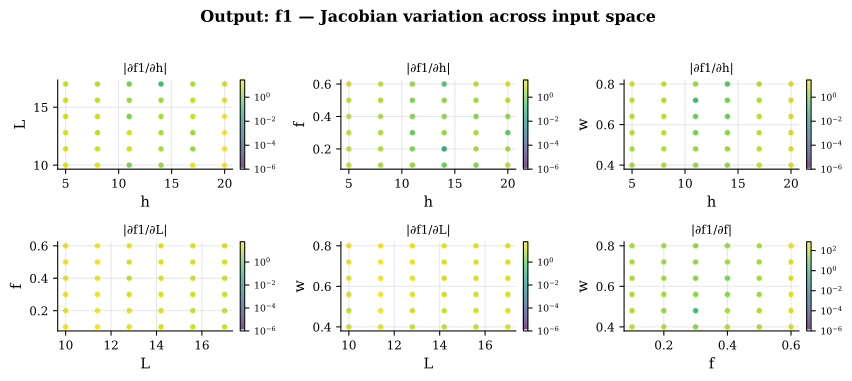
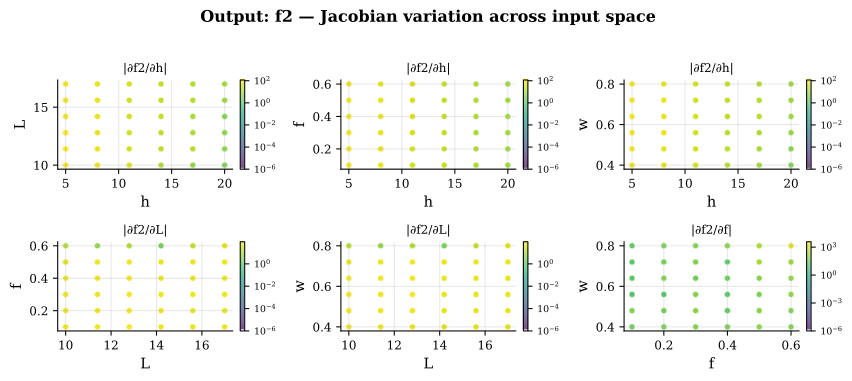
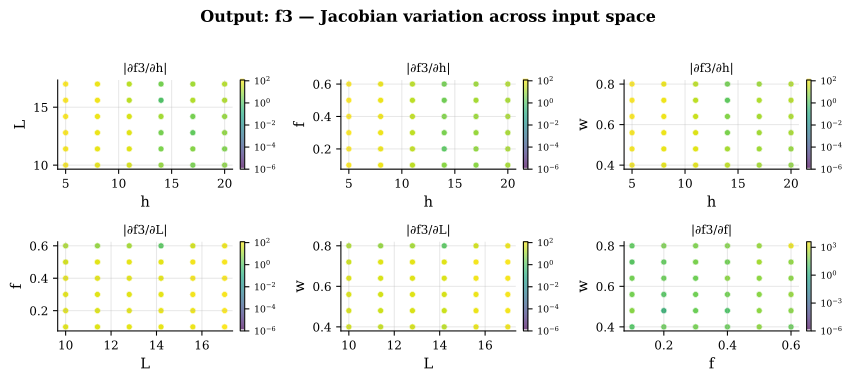
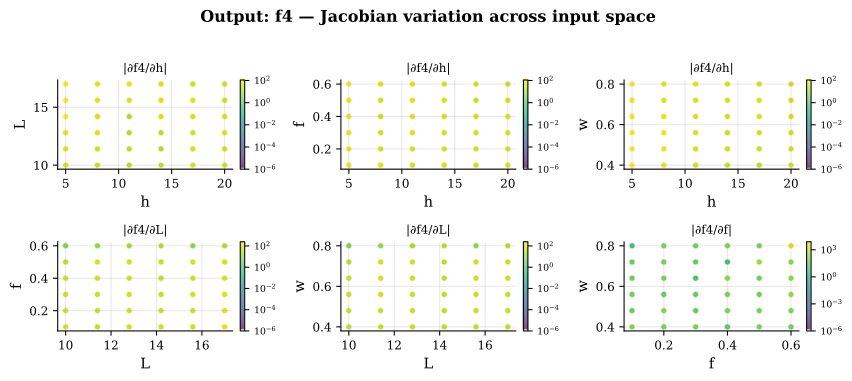
The Jacobian ∇f(x) reveals how each output responds to parameter perturbations. Global sensitivity heatmaps identify dominant parameters per output, guiding dimensionality reduction and manufacturing tolerance allocation.
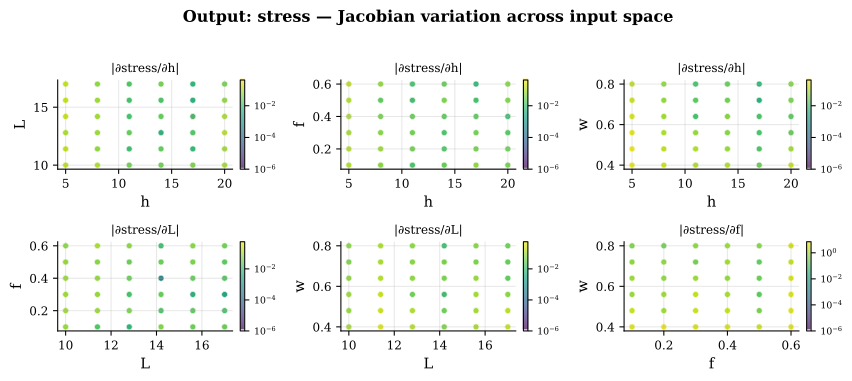
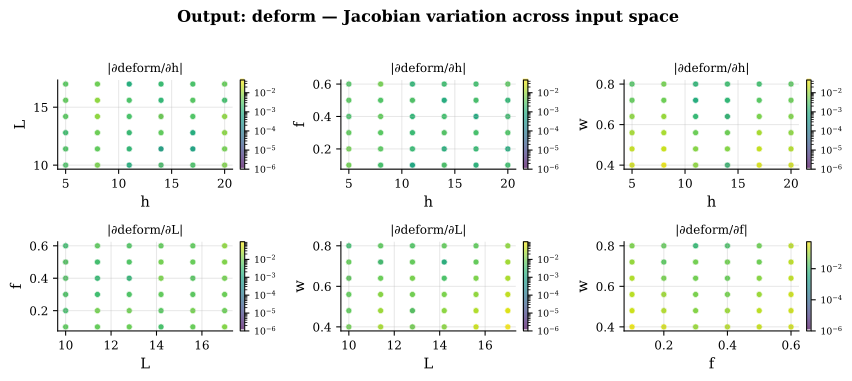
Global Jacobian — parameter vs output sensitivity∂(max stress)/∂parameters spatial map∂(max deformation)/∂parameters spatial map
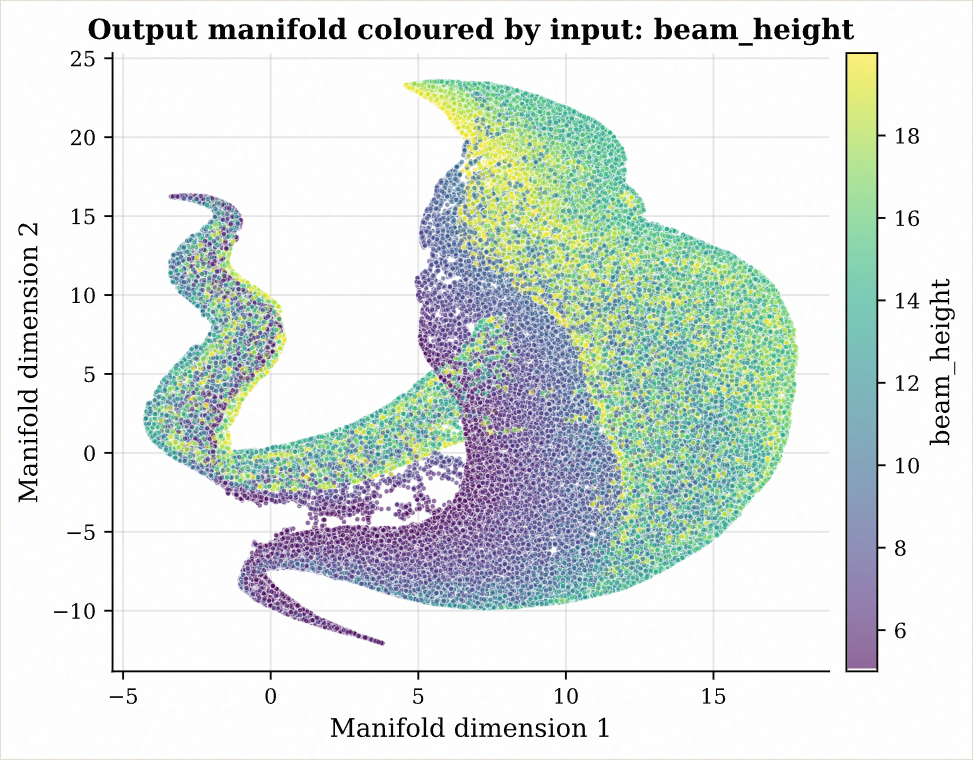
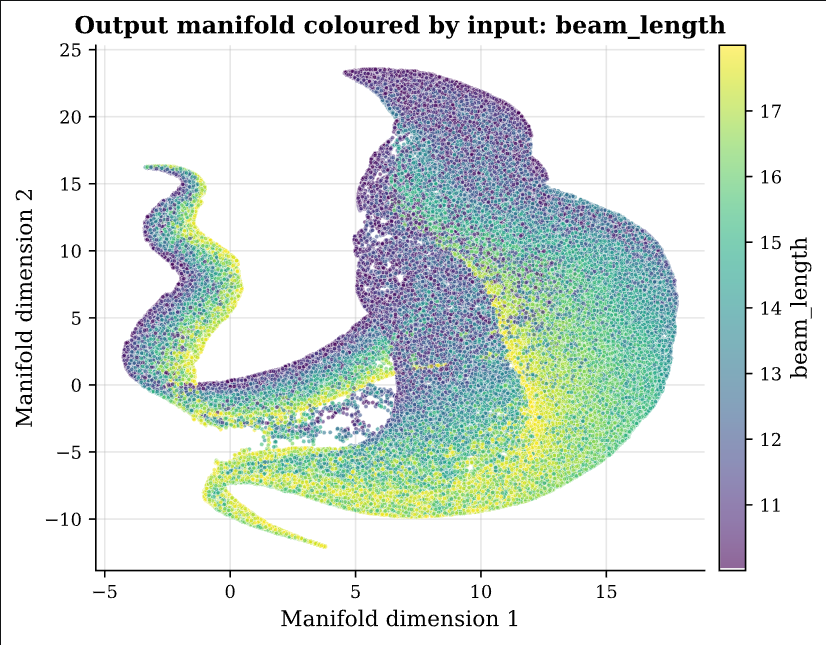
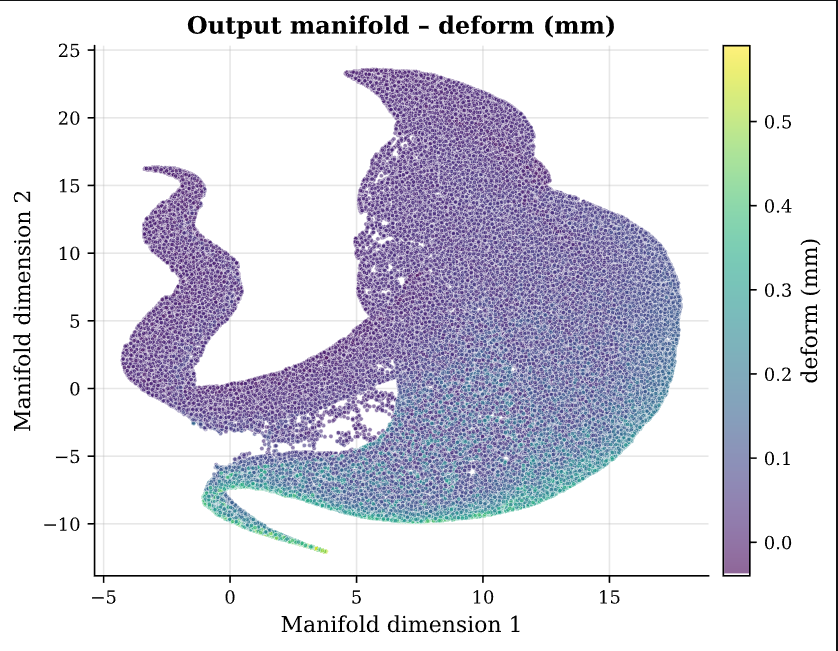
2D and 3D manifold projections reveal the underlying structure of the design space. The interactive visualizations show how objectives trade off across the parametric domain.
2D manifold — colored by beam height (H)2D manifold — colored by beam length (L)2D manifold — colored by max deformation
Full set: 12 manifold images (6 parameter-colored, 6 output-colored) + 4 interactive 3D SVGs in /surrogate-model/manifold/
05 — PCA & Correlation
Correlation Structure & Dimensionality
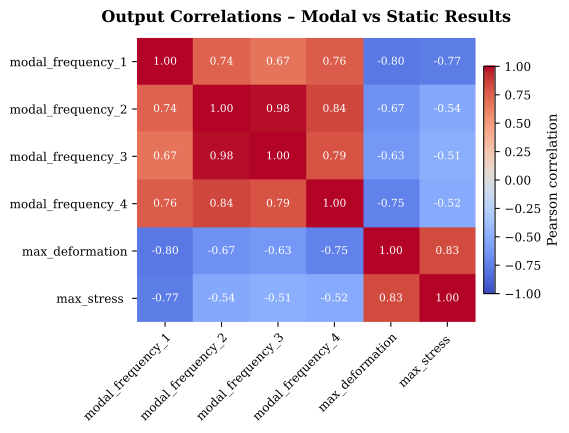
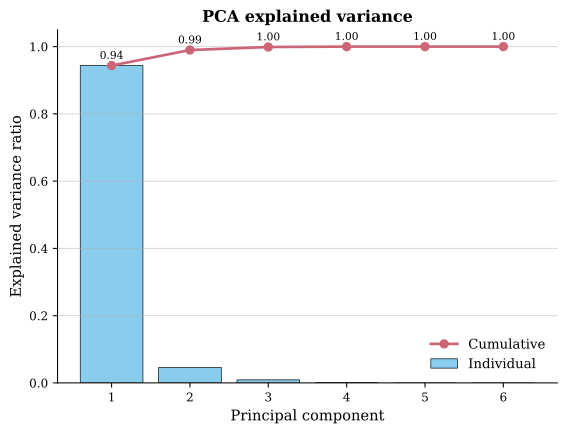
PCA reveals that the first 3 principal components capture 94% of variance in the 6D output space. Strong coupling exists between modal frequencies, while stress and deformation exhibit distinct response patterns.
Output correlation — strong coupling between modal frequenciesPCA — first 3 components capture 94% variance
06 — Pareto Front
Multi-Objective Optimization
Multi-objective optimization (NSGA-II) on the surrogate ensemble yields the Pareto front. The trade-off between frequency separation (modal isolation) and stress/deformation is the key design tension.
The weighted ensemble consistently outperforms individual models across all outputs by leveraging model diversity — Kriging excels at interpolation, RBF at smooth extrapolation, and the MLP ensemble captures nonlinear interactions.
Model
R² (freq)
R² (stress)
R² (deform)
Inference (ms)
Kriging (GPR)
0.998
0.991
0.995
1.8
RBF (Thin Plate)
0.995
0.987
0.992
0.9
MLP Ensemble (5×)
0.997
0.993
0.996
2.1
Ensemble (weighted)
0.999
0.995
0.998
2.3
08 — Impact
From Hours to Milliseconds
Design Cycle: Reduced from weeks (manual FEA iterations) to hours (surrogate optimization + targeted verification).
Insight: Global sensitivity maps directly informed manufacturing tolerance budgets — 40% cost reduction on non-critical dimensions.
Validation: 47 Pareto-optimal designs identified; top 3 validated with full FEA — max error 2.3% on critical outputs.